
When it comes to investing, the S&P 500 – a stock market index which tracks the performance of the 500 largest companies listed in the US – is arguably the most famous index in the world.
With US media dominating our news feeds, and many of the household names we recognise being in the US (for example, Apple, Google, Amazon, Microsoft, etc), it can be easy for investors to neglect the rest of the world and focus solely on the US.
While the US market is the single largest stock market in the world (accounting for c.50% of global stock markets), failure to diversify beyond the US is a decision to ignore half of the world’s greatest companies within your portfolio.
In this article, we examine the compelling reasons why international exposure is not just advisable, but essential for optimising investment portfolios and driving your overall financial plan.
“But the US market delivers the best returns?”
This is a common misconception based on recency bias.
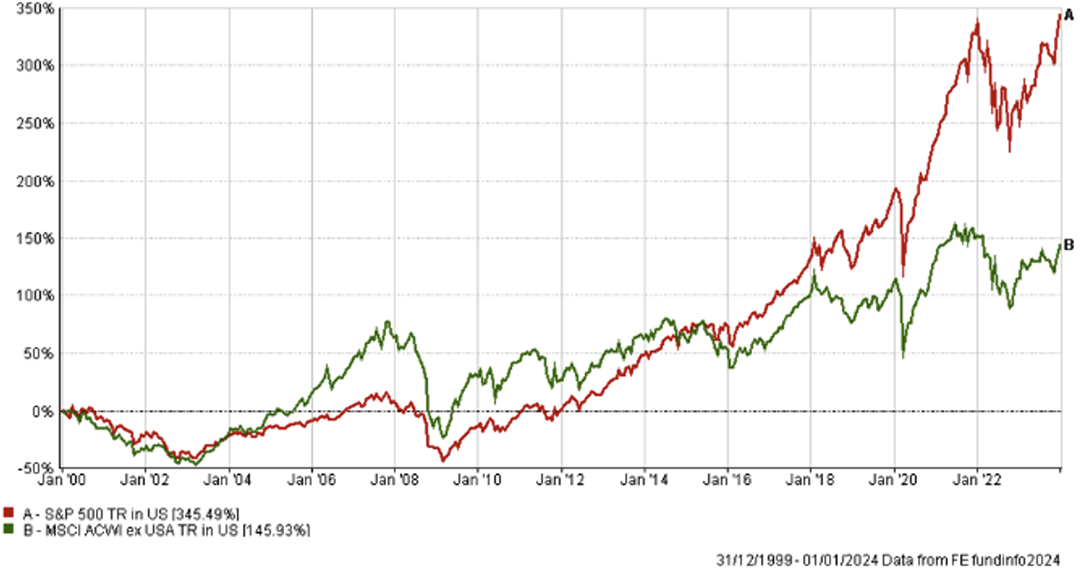
So far this century, US markets have dominated international markets, returning 345% (US) vs 146% (rest of the world).
However, do you know how much of this outperformance has come in the last decade?
All of it!
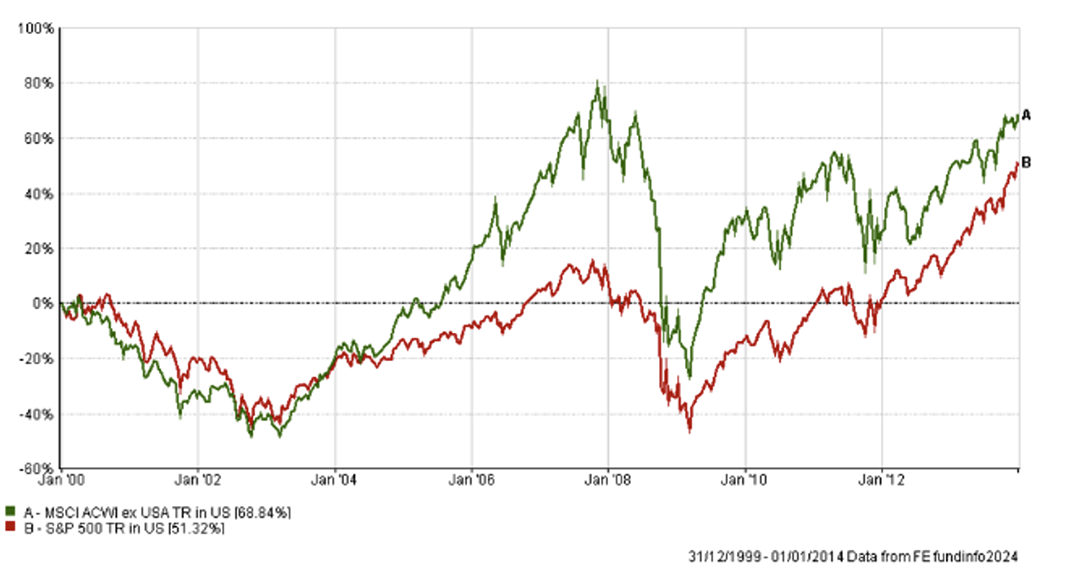
Prior to 2014, US markets trailed international markets, returning 51% (US) vs 69% (rest of the world).
US Stocks vs International Stocks (2000 – 2024)
US Stocks vs International Stocks (2000 – 2014)
The S&P 500 ≠ The US Market
This is an important distinction often overlooked by less sophisticated investors.
The S&P 500 tracks the largest 500 companies in the US.
This represents 80% of total US market capitalisation, but the remaining 20% is still very significant – there are over 3,500 listed companies in the US, so by investing in just the 500 largest, you are missing out on accessing the full potential of the US stock market and the diversification benefits of a broader investment portfolio.
It’s also worth remembering that, by definition, the S&P 500 is a large-cap index, so you miss out on the significant small cap exposure provided by companies not included within the S&P 500.
This is important because smaller companies tend to outperform larger stocks over the long term.
The S&P 500 might not be as well diversified as you think…
On the surface of it, investing in 500 different companies sounds like a lot of diversification.
However, at the time of writing, the largest 7 companies (dubbed the Magnificent 7) – Microsoft, Apple, Nvidia, Amazon, Alphabet (Google), Meta (Facebook), and Tesla – make up 28.9% of the S&P 500.
To put this another way, for every $500 invested in the S&P 500, $144.5 is invested in just 7 companies.
Not only does this create high levels of concentration in a small number of companies, but also concentration in the same country and the same industry (technology).
Beyond the obvious lack of diversification, this creates two other major challenges for investors to navigate:
1. The top companies in the index change all the time – the “magnificent 7” is a term that was only coined in 2023. Just a year before that it was the “FAANG” stocks.
To put this in context, the table below shows the top 10 companies in the S&P 500 a decade ago, and the survivors that are still there today:

If we extend this to 20 years, Microsoft is the only surviving company, and if we extend it to 30 years, there are no survivors.
For long term investors, it is impossible to predict who these companies will be ahead of time.
2. With that in mind, note that eye-popping returns tend to happen before stocks reach the top of the market.
Intuitively, this makes sense – that is how they become the biggest names in the index. The recent performance of the Magnificent 7 is a good example of this.
However, what might be less intuitive is the fact that once a company reaches the top of the market, subsequent returns tend to lag the market. Fig 1 below illustrates this, showing the average performance of companies before and after they enter the top 10 largest US stocks.
This ultimately explains the turnover levels and why the top 10 companies change so frequently.
Fig. 1
View from the Top
Annualized returns in excess of the US market before and after joining the top 10 largest US stocks, January 1927-December 2022

Source: Dimensional Fund Advisers
Rather than seeking additional exposure to these largest stocks, investors should ensure their portfolios are broadly diversified to capture the returns of whatever companies ascend to the top in the future.
Diluting Hype and Buying Cheaper (Value vs Growth Companies)
Within evidence-based portfolios, a value tilt is a strategy that involves overweighting companies with lower price-to-earnings (P/E) ratios than the overall market.
The rationale behind this is that “value companies” are valued at a low price compared to their fundamental value, and thus have higher expected returns over the long run, as the market corrects this mispricing.
Value companies tend to be more “boring”, with strong business models and healthy accounts.
Meanwhile, “growth companies” are generally more exciting, younger, early-stage companies, who are expected to see rapid growth in future. Thus, the future expectations around these companies – i.e. hype – tends to inflate the share price of growth companies and they tend to be valued at a high price compared to their fundamental value.
The historical evidence suggests that, while disappointing periods emerge from time to time, value companies tend to outperform growth companies over the long term. Since 1927, value companies have outperformed growth companies in the US by an average of 4.4% (see fig. 2 below).
In short, investors tend to get excited about growth companies and favour them over less exciting, stable companies. Because of this, investors overprice growth companies and underprice value companies, creating opportunity for investors to capture this “premium” as prices revert to the mean.
Fig. 2.
Yearly observations of premiums: value minus growth in US markets, 1927-2022

Source: Dimensional Fund Advisers
In recent years, the US market has been dominated by growth stocks, particularly in the technology sector (and more recently, AI), and is currently considered “expensive” with a P/E Ratio of 23.28.
By investing in international stock markets, investors can gain exposure to comparatively cheaper markets with more value characteristics (see fig. 3 below, showing the P/E Ratios – i.e. the relative “expensiveness” – of stock markets around the world).
So, although US growth companies – and thus the S&P 500 – have dominated headlines in recent years, history is on the side of value over the long term. Investors should keep this at the forefront of their thinking when considering their future goals and the construction of the portfolios required to achieve them.
Fig. 3

Source: worldperatio.com
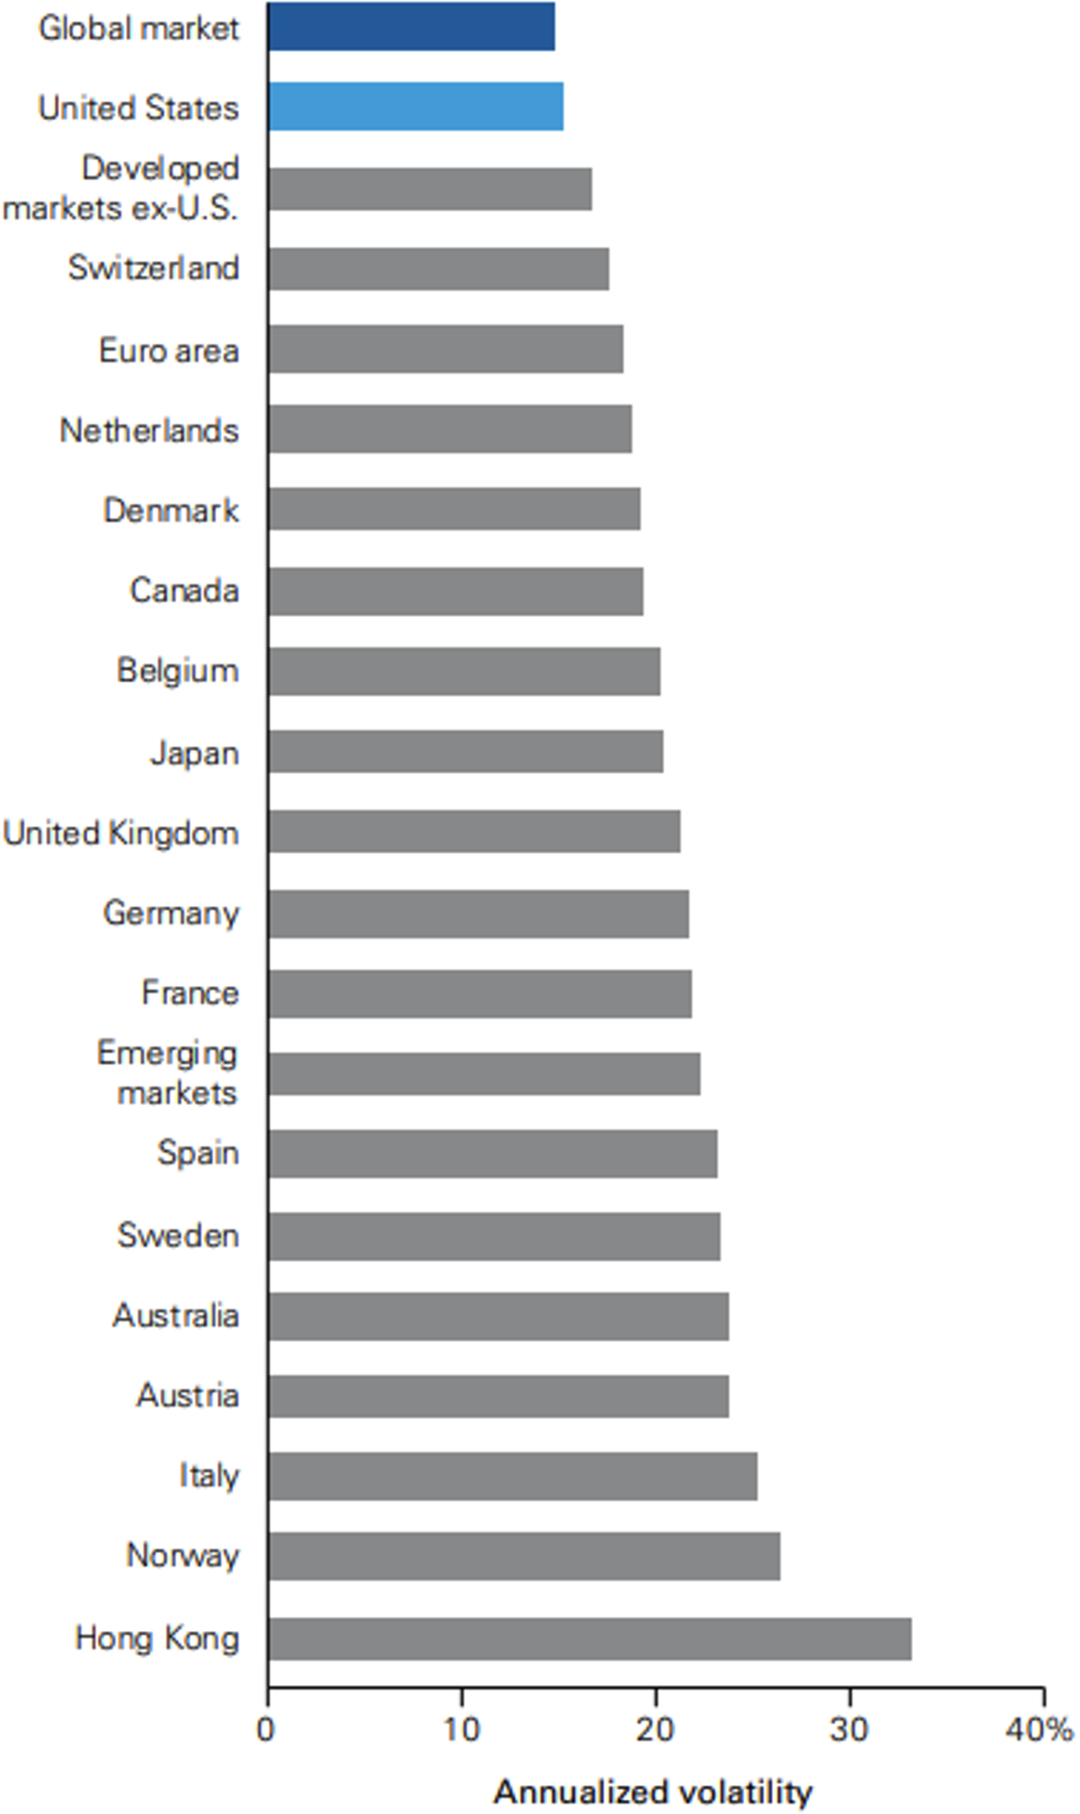
A Smoother Investor Experience – Managing Portfolio Volatility
A key component to disciplined long-term investing and good investor behaviour/staying the course, is the ability to sleep at night in the short term.
The more volatility in your portfolio over the short term, the more difficult this can be.
Whilst the US market has fared better than most other stock markets around the world in this regard, according to data from Vanguard a globally diversified portfolio adds significant benefit and makes your portfolio even more stable (see volatility table below).
Source: Vanguard
The Power of Diversification & the Randomness of Stock Market Returns
It is incredibly difficult to predict which county’s stock market will outperform each year.
Fig. 4 below shows the annual returns for developed markets around the world, with each colour representing a different country’s stock market, each column representing a year (2003 – 2022), and ordered best performer (top) to worst performer (bottom).
As you can see, predictions are impossible – New Zealand posted the highest returns in 2019, but the lowest in 2021.
The US market ranked 4th best for annualised returns over the entire 20-year period, but only finished in top spot once (2014).
It’s also worth noting that by investing in the US only, investors would have had no exposure to the top 3 performing stock markets in the world over this period (Denmark, Australia, and Sweden).
Fig.4
Annual returns for developed markets, ranked (2003-2022)

Source: Dimensional Fund Advisers
Overall, this highlights the importance of diversification within investment portfolios – although there are macro trends that impact the global economy, local economies tend to run in their own individual cycles and can be in boom or bust periods at different times.
Global diversification ensures that you are not overly exposed to any one country or market.
From a growth perspective, this ensures that investors are positioned to capture returns no matter where they come from, and capture higher returns when they appear.
From a risk mitigation perspective, this ensures that the outperformance of one market at any given point in time, can help to offset lower returns from another.
Conclusion:
The US market is the largest single market in the world and makes up 50% of global stock markets. There is no doubt therefore, that it plays a significant role in our investment portfolios.
When it comes to the S&P 500, the index is a perfectly good component to your portfolio. It should, however, not be your entire portfolio.
The S&P 500 is not a complete barometer for the US stock market, nor does it offer exposure to global stock market returns.
Overall, globally diversified portfolios can help to provide more reliable outcomes over time, and a smoother investment journey along the way.
By Technical Team @ Abacus
Please keep in mind that, whilst we aim to update these articles periodically, the content could be subject to future rule changes. Always make sure to speak to a qualified professional to ensure you have the most up to date information and are taking regulated advice around your specific circumstances.